
Overview
In that last topic, we briefly talked about the “Dummy Report.” Maybe not the most professional name but here’s the point. Sometimes (often), you’ll need to create a very simple report view for a stakeholder (either smart or a dummy) which only pulls very specific information which will help them understand what’s happening.
In this lesson, we’re going to follow the following steps to create our very first “Dummy Report”.
- Report Planning: We’re going to outline what our report needs to accomplish.
- Basic Setup: We’re going to create the report.
- Report Metrics: Assign the metrics (quantitative values)
- Report Dimensions: Dimensions in this case are the “campaigns”.
- Report Filters: Assign needed filters.
- Report Testing: Does the report do what we meant it to do?
- Report Sharing Options: Review the sharing options.
Onward!
Let’s Build a Dummy (report)!
Step 1: Planning
John, our company’s owner, is a smart guy (sometimes). He doesn’t like to get buried in the “details” because it cuts into his golfing time. Anyways, he’s asked us to provide a report on our email marketing efforts. Specifically, he wants to see a monthly report which shows all our email marketing campaigns and how much money they made him.
Let’s outline this in bullet points:
- Monthly report
- Shows only email marketing traffic
- Shows all email campaigns
- Relates Revenue to each campaign
That’s it, now let’s start building it!
Step 2: Basic Setup
Now, let’s create the report.
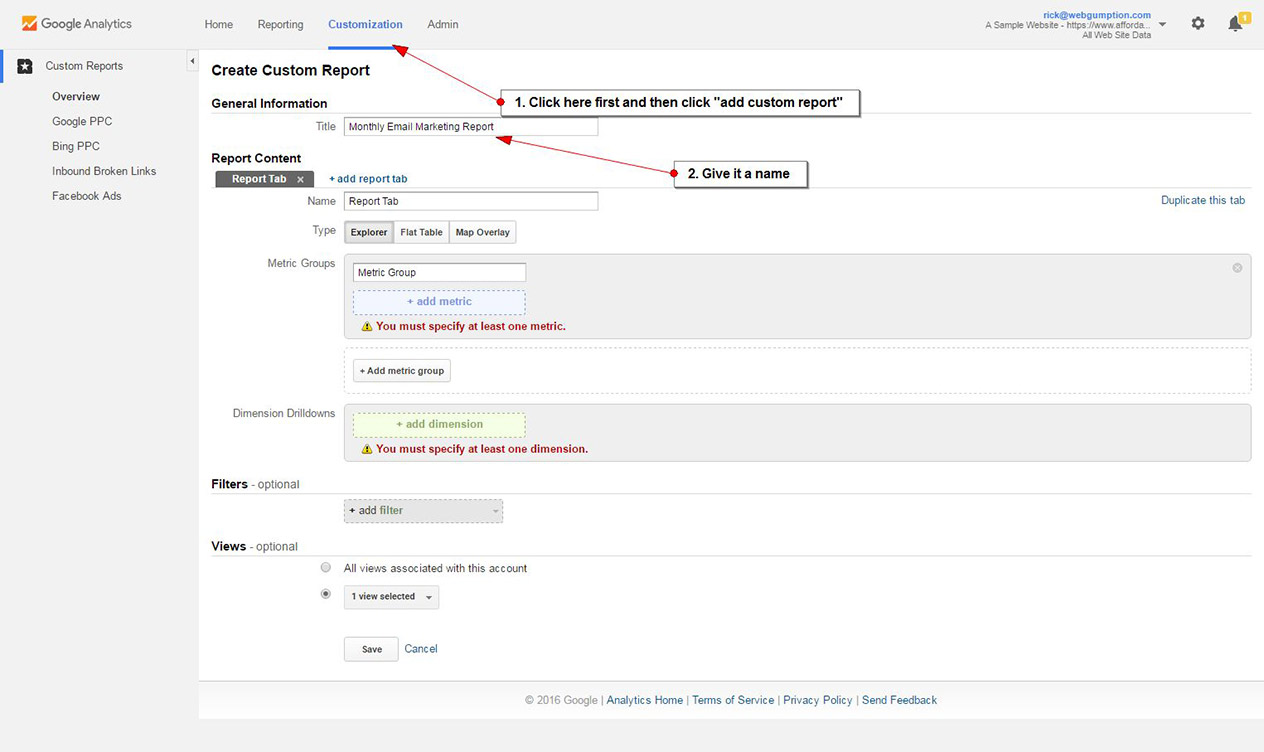
- Click the “Customization” link on the Google Analytics top navigation bar.
- Click “New Custom Report”
- Name the report: Monthly Email Marketing Report (probably best not to use the word “dummy” here)
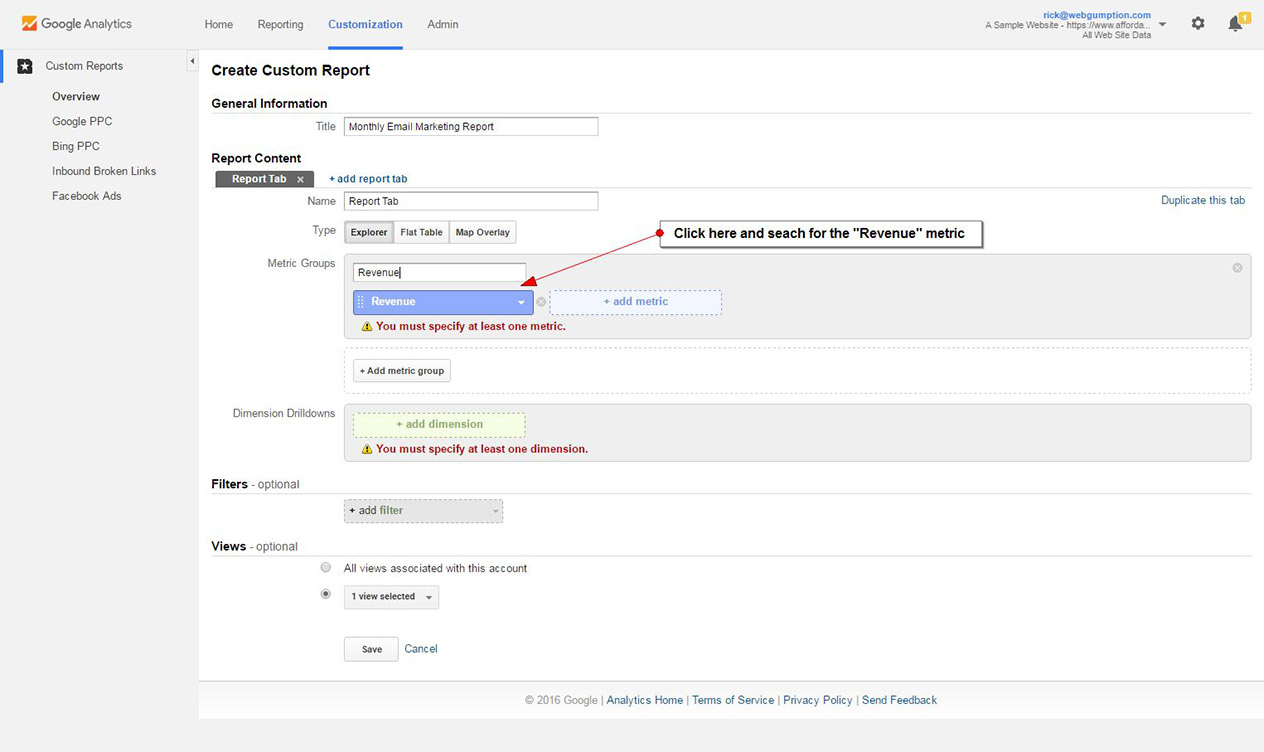
Step 3: Report Metrics
Metrics are quantitative. For this report, John said he only wanted to see revenue from email marketing campaigns. So, we want to add just 1 metric- Revenue.
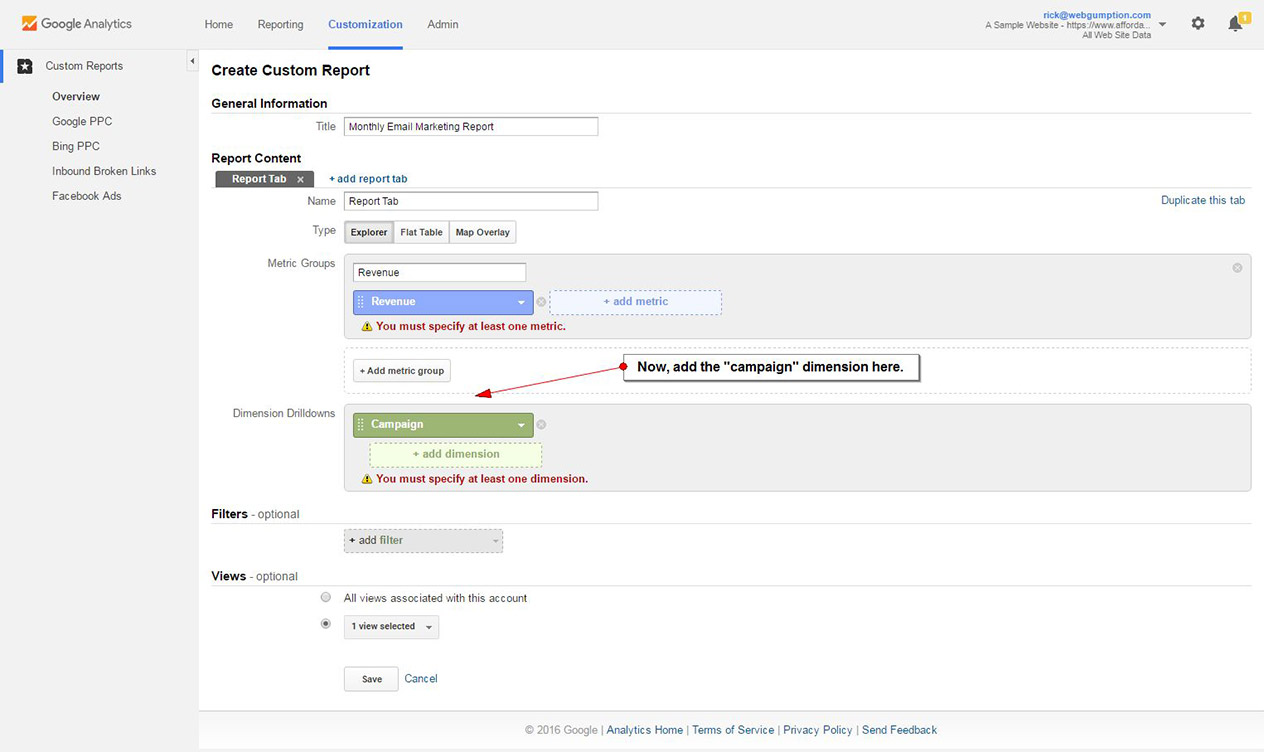
Step 4: Report Dimensions
Think of dimensions as being everything that is not quantitative. They include “categories” for which we want to view our Metrics. In this case, John has asked to see the campaign name as it relates to revenue. Campaign then, is our dimension.
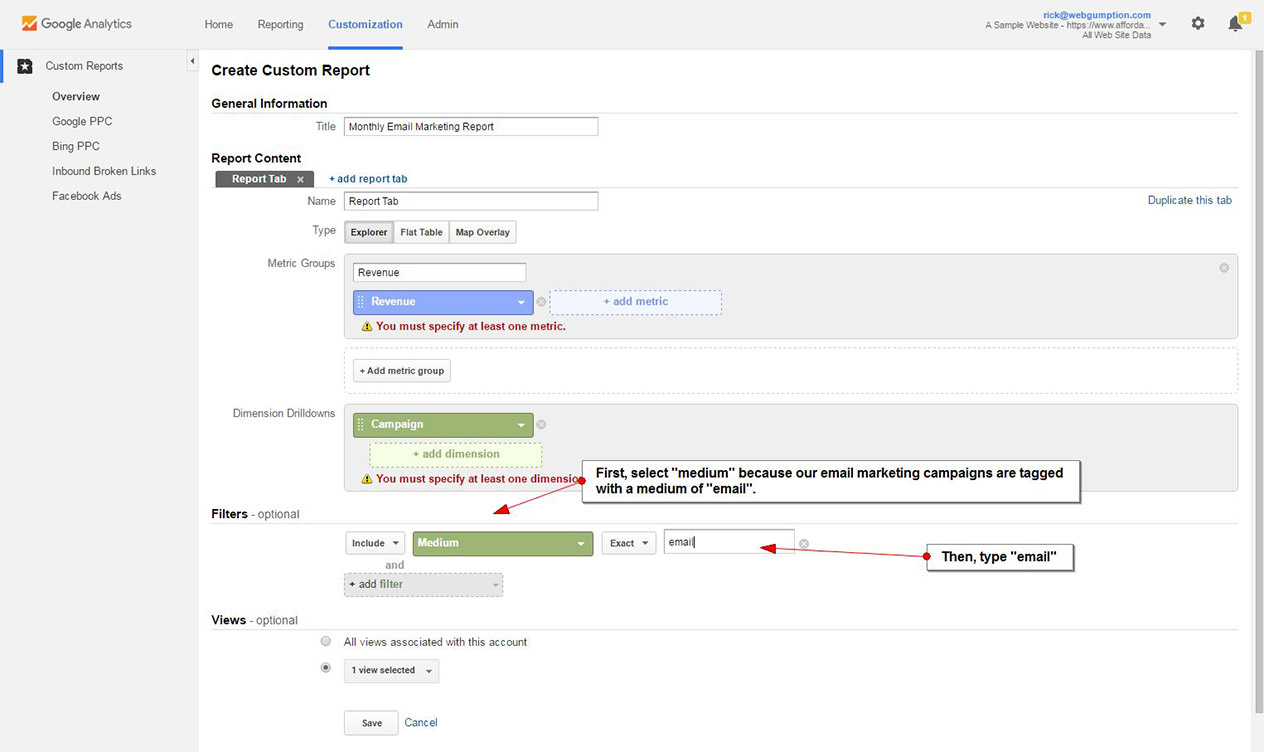
Step 5: Report Filters
Filters allow us to limit the data in our report based in a number of ways. For John’s report, he’s asked us to show only Email marketing campaigns. So, we need to set a filter on this report so that our other marketing campaigns do not pull in to the report, causing John to feel anxiety which again, is bad for his golf game.
For this step, choose the “medium” selector and then type “email”. This will filter out all campaigns which were not tagged as email campaigns. When done, SAVE the report.
Step 6: Test
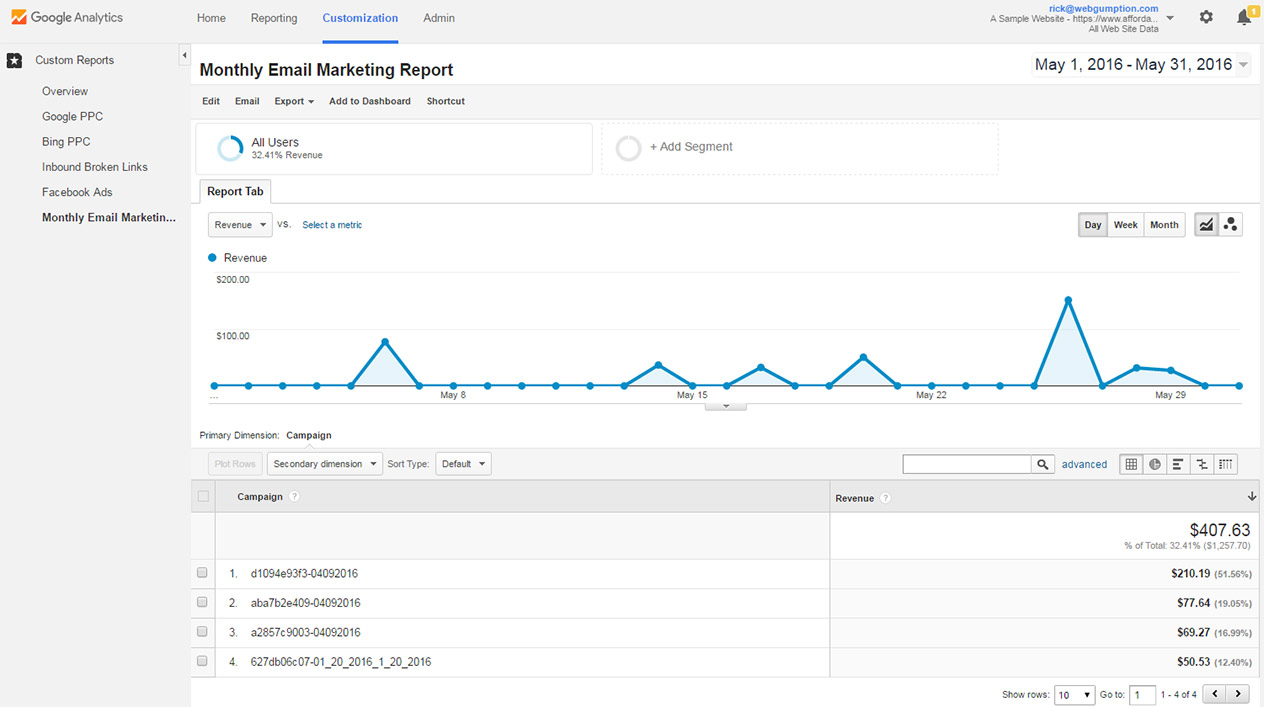
After saving the report, you’ll be redirected to view the report. Is this what John asked for? What we have is a very simple report which displays the Dimension “campaign” and the associated metric “revenue” for all traffic filtered for “email only”.
Step 7: Sharing
Our Dummy Report has no value unless we share it!
Sharing is easy. Note that above the report chart there’s a button which says “email”. Click that to configure how you want to share the report. You can share it one time or set a recurring automated report.
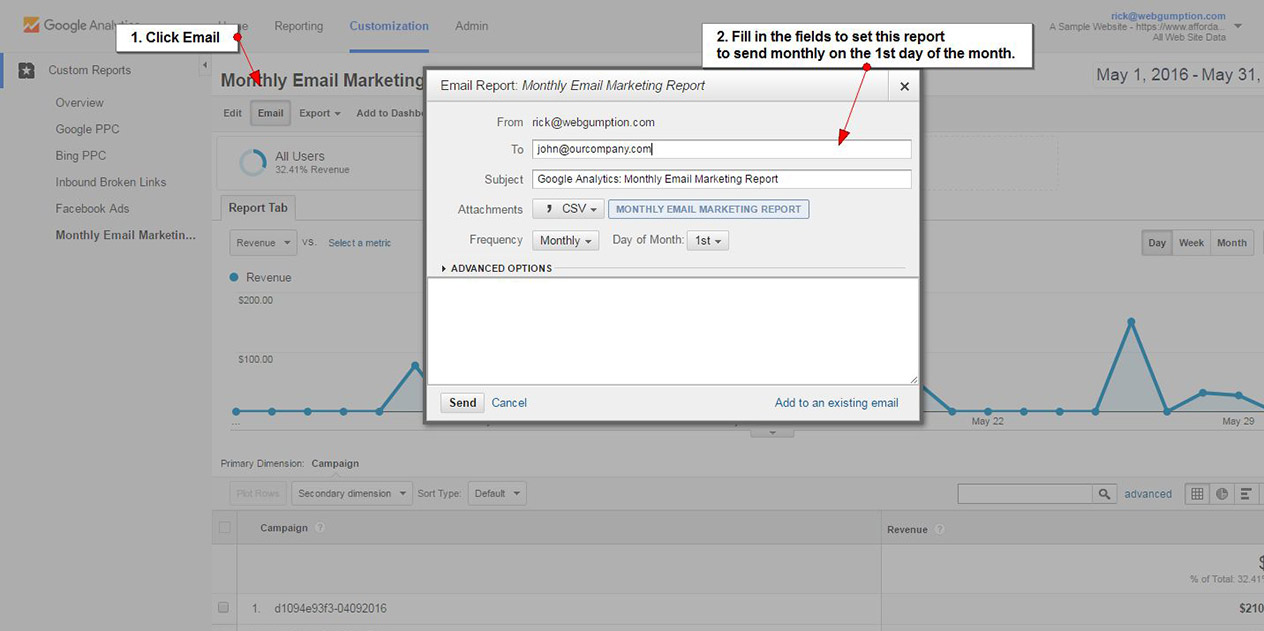 Now, your new report can be viewed any time from the custom report dashboard and will be emailed to John monthly so that he can review the stats.