Today’s post on using custom rolling dates in Google Data Studio is brought to you by the color blue!
Seriously though, we totally had trouble figuring out how these worked (and probably mis-reported a bit) so once we did, we wanted to run through the seemingly simple feature. Video below.
How to Use Custom Rolling Dates
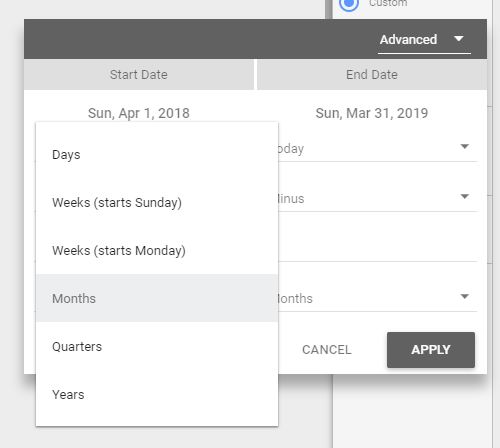
Configuring Rolling Dates

GDS Rolling Dates
- Set the date range to “Advanced”
- Set the start date rolling logic
- Set the end date rolling logic
- Set the comparison range (optional but great for showing trends when seasonality affects the data)
Considerations
We feel that there are few considerations in using this feature.
- Don’t accidentally omit data by using the wrong time dimension. For example, rolling the past 365 days is DIFFERENT than rolling the past 12 months.
- Consider omitting the current day/month/year when trending over time as the current period is incomplete until the period is complete (and may cause confusion among your audience)
Resources

Hi Rick,
This was a super helpful video. It seems as though an advanced timeframe for a time series chart is specific to that single chart and does not adjust with a sheet-wide date selector. Is that correct from what you’ve seen?
Thanks!
Thank you! For a time series chart, you’re overriding the sheet-wide data selector for sure. However, the same advanced logic for rolling dates is available in the date selector if you needed it.
Thank you, Rick.
I have a table where I’ve set an advanced date range just like you do in the video and added advanced comparison date range as today minus 24 months / today minus 13 months, in order to see the percentual change month over month. The trouble is the automatically inserted compare column doesn’t get any values.
Do you know why that is?
The weird thing is that the total percentual change is shown correctly in the summary row of the table.
Hi Martin,
I’m not sure that I completely follow. Can you screencapture and share via a link? Best to go to “edit” mode in GDS and try to capture the chart itself and the settings.
Thanks for replying.
Here’s a screenshot:
https://i.imgur.com/L87WI8Y.png
I had to remove the “Available Fields” pane to capture all the table settings in one shot. Oh, and “Månad och år” translates to “Month and Year” in Swedish.
As I said, I’ve used the Advanced option to set default date ranges as follows:
* “Primary” date range start: Today minus 12 months
* “Primary” date range end: Today minus 1 months
* Comparison date range start: Today minus 24 months
* Comparison date range end: Today minus 13 months
(Small typo: _”Månad på året”_ translates to “Month and Year”)
Hey Martin,
What if you just switched your comparison date range to “previous year” as opposed to using the advanced function. I think you’d get the same result?
Rick
Yes, I do get the same comparison date range when I do that, but the delta column stays empty…
The weird thing is that the figure 3.7% in the table summary row _is_ correct.
I found it. Change from “month of year” to “month of THE year”.
Rick
Really appreciate this!
You could have mention that the number of column has to be 12 in the design tab.
By default it’s 10, and I didn’t understand why my rolling year was ending 2 months from “today”…
Great video anyway? Many thx